Improved accuracy: Simulations can help identify potential sources of error in the dispensing process. This can result in more accurate dispensing amounts, less waste, and better product quality.
Faster development: Test multiple designs and configurations in a shorter amount of time with faster simulations.
Lower costs: Building physical prototypes can be expensive. Simulations can reduce the number of physical prototypes, saving money on materials and labor.
Increased safety by preventing accidents and injuries: Dispensing systems that handle hazardous materials or operate in dangerous environments can be simulated to identify potential safety issues before they occur.
Dispensing systems are used in a wide range of industries, from food and beverage to pharmaceuticals and chemicals. These systems are responsible for accurately measuring and dispensing precise amounts of liquids which is crucial for maintaining quality control and ensuring product consistency.
An effective way to optimize these dispensing systems is through simulation. By creating a virtual model of the system, engineers can test different scenarios and variables in the simulation, requiring fewer physical tests. This can save time and money, as well as provide valuable insights into how the system will perform under different conditions.
Overall, simulating dispensing systems offers a range of benefits that can improve accuracy, speed up development, reduce costs, and increase safety. Manufacturers are embracing simulation as an important engineering tool to optimize their dispensing systems and other complex processes.
Dispensing applications benefit significantly from the mesh-free, Lagrangian CFD method SPH. This is especially true for free surface flows, splashing fluids, or cases with moving parts or complex geometries.
When resolving multiphase phenomena using SPH, the interface between two fluids, like air and glue, is naturally detected. Unlike mesh-based methods, no special treatment is necessary. This results in faster simulations.
Moreover, SPH allows the discretization of a liquid without discretizing the surrounding air. An example of this might be a case in which the glue distribution inside injection gluing is of interest. The liquid only makes up a small percentage of the domain. In mesh-based methods, the entire domain needs to be discretized.
The video above shows glue injected into a cavity. Here, the air phase is simplified so that no particles are necessary to resolve it. The simulation aims at identifying how long it takes to fill the cavity and whether the glue is well spread. Mesh-free SPH simulation easily allows for modeling the flow around both, round and sharp corners, as well as in narrow regions.


Industry Example
Engineers in the adhesive industry need to compare different adhesives to find the optimal filling time. Simulation saves them time, reduces material waste, and improves the gluing process. Below, we're summarizing what a typical process can look like, based on real industry use cases in manufacturing, and how engineers can benefit from simulation.
To get more data faster and validate their hypothesis, design engineers compare multiple cases against each other with parallel simulations. With the Dive CAE software, multiple simulations run without compromising on speed, thanks to high-performance computing in the cloud.
Engineers in the adhesive industry want to analyze the flow behavior during the application of the glue, dependent on material parameters like viscosity and surface tension. In the past, they could only conduct empirical analyses through sequential experiments, which is a lengthy process.
Simulations speed up the process significantly by analyzing different material properties and reducing the testing time. To get more data faster and validate their hypothesis, the design engineers would compare several cases against each other with parallel simulations. The simulations run fast and simultaneously, thanks to high-performance computing in the cloud. With the Dive CAE software, design engineers can analyze multiple parameters with an efficient DOE, of varying kinematic viscosity, surface tension coefficients, and densities. It's possible to simulate very small droplets creeping through thin gaps.

Thanks to our cloud-native software, you can run multiple tests simultaneously and get results faster
The results, such as those described above, can be reached within just one day of setting up a simulation with the Dive CAE software. In this case, the Dive software would enable the engineers to see the distance the fluid creeps due to capillary effects. Our software saves engineers the time and hassle it takes to do tedious tasks, such as calculating numerical values. Instead, design engineers can use the results to conduct trend analysis. They resulting rendering can immediately be shared with both technical and business departments, to improve the final adhesive gluing process.
Simulate Splashing Effects and Droplet Formation:
In industrial applications such as dosing and dispensing, engineers aim to control droplet formation and mitigate splashing. Other use cases include cleaning, coating, or wetting phenomena, where a thin layer of fluid spreads on various surfaces. Surface tension effects also dominate in the area of microfluidics, where they manifest as capillary forces. A day-to-day example would be the flow from a tap inside a sink. Some typical industry examples include:
All these effects are governed by the surface tension properties of the fluid at hand. Surface tension is determined by how strong the molecules of a fluid cling to one another as opposed to any other material, e.g. the air at a free surface or a solid material at the wall. Therefore, it is quantified using two parameters: i) the surface tension coefficient, modelling the interaction of the fluid with air (or any other fluid it is immersed in, and ii) the contact angle, i.e., the angle a droplet of the fluid-air boundary encloses with a solid wall.
Dive's Surface Tension Model treats both the surface tension coefficient and contact angles as first-class inputs, i.e. they are directly defined by the user with no artificial tuning parameter involved. The solution, thus, allows for an easy yet accurate prediction of droplet formation and related effects.
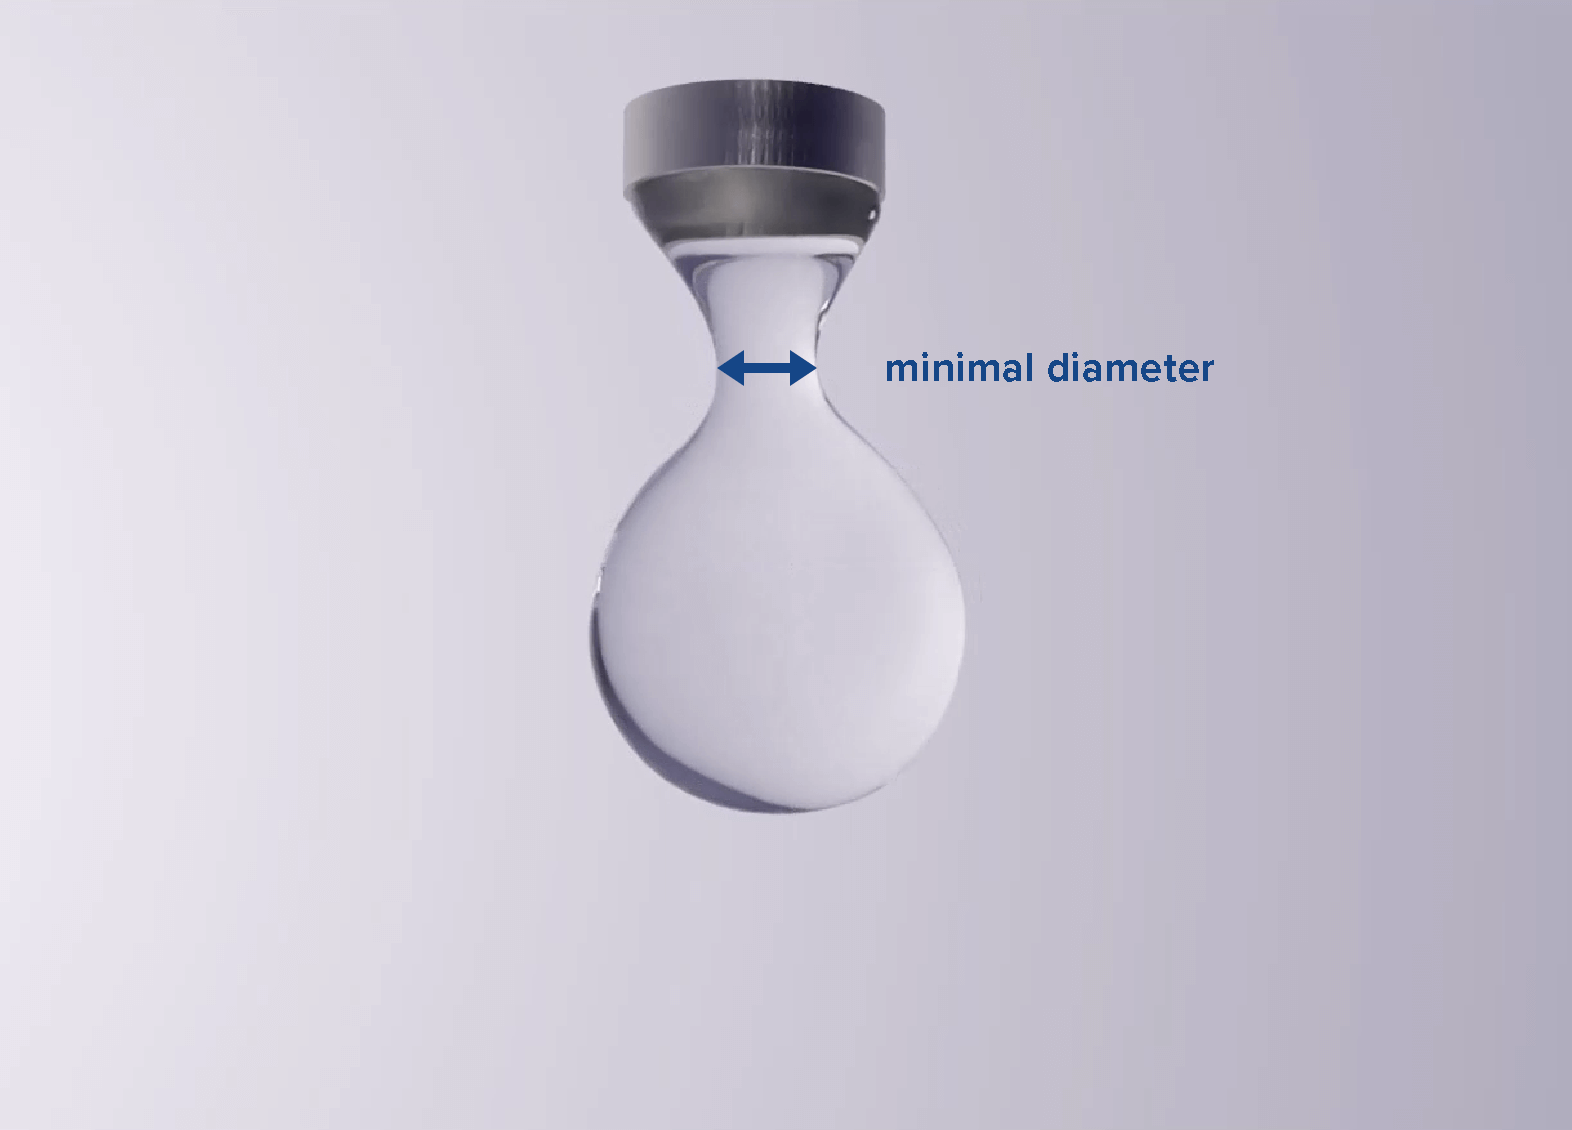
Let’s consider an experiment from Dinic and Sharma as a benchmark. In this work, the formation of a water droplet was studied. This video shows the process when replicating the experiment using the Dive CFD software. The entire process from setup, to result, and creating photorealistic rendering with the Dive CFD software is typically completed in less than a day, only requiring up to 1 hour of human input.
More importantly, the simulation results are not only visually appealing but also quantitatively accurate. In the experiment, the minimum diameter of the detaching droplet has been recorded and fit to a function of time. The following graph compares these measurements with results from the simulation:
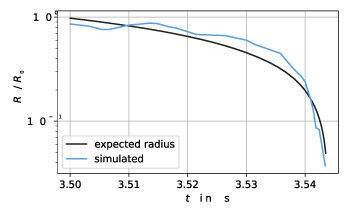
The simulation predicts the diameter accurately. Note that the graph ends when the droplet detaches from the outlet, i.e. when the minimum diameter is 0. Thus, the simulation allows to compute the dripping rate from the outlet, a crucial quantity for dosing applications.
Surface tension is also responsible for capillary forces occurring in microchannels and small gaps. For instance, consider glue that flows in a tiny gap between two components that are meant to be glued together. Accurately predicting this process requires an accurate surface tension model. A simple benchmark for this effect is the capillary rise test: Immersing a thin tube into a basin of fluid will trigger the fluid to rise inside the tube. The height to which it rises depends on surface tension and can be calculated according to Jurin’s law. The following graph shows a comparison of filling height found with a simulation compared to the result computed using Jurin’s law.
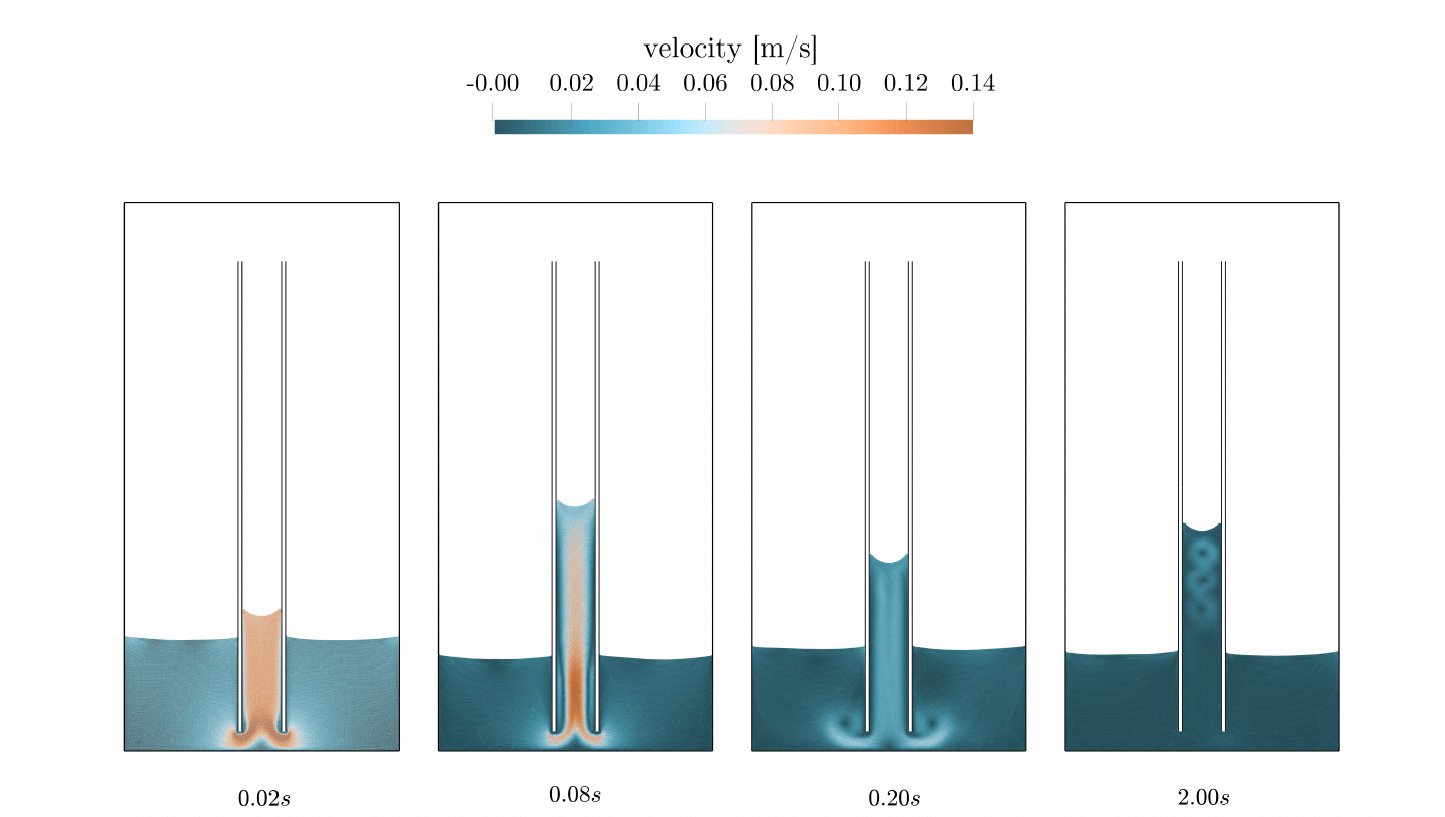
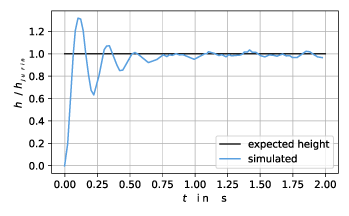
Not only is the simulation predicting the right height for the fluid column inside the capillary, but in contrast to computation from Jurin’s law, it’s also time-resolved allowing the engineer to forecast the time necessary to get the fluid inside the tube. Of course, the simulation is not limited to simple geometries. This is where exciting engineering begins. A practical example is microchips that are meant to be connected to a circuit board. In a first step, the chips are soldered to the board. For extra durability, the volume between the chip, board, and soldered joints is then filled with glue, exploiting capillary effects.
The video shows the process. Glue is dispensed to a 2 mm gap. Several microbeams connect the two surfaces and represent the soldered joints. They render the free volume between the two surfaces even narrower. The entire structure has a width of 3 cm. As shown in the video, when dispensing glue to one side, capillary forces are dragging it into the gap. Because close to the microbeams the forces are stronger (due to the narrower volume) the dispensed glue is more prone to go there. A simulation like the one shown above allows the engineer to assess the result, and adapt the dispensing location, the speed at which glue is dispensed, the amount, or even the type of glue utilized.

Surface tension without artificial tuning parameters to calculate effects like capillary effects in gaps and droplet formation

Complex moving and stationary components to simulate geometrically complex parts including windings

High and low viscosity to analyze flow behaviors
If your engineering team is dealing with liquids and heat management, chances are this is the right software for you.
Use the Dive CFD software, free for a week, including service by a Customer Success Engineer who will ensure successful results for your project. No strings attached. Comfortably evaluate your project before you commit to a subscription.

A Dive representative will contact you, typically within 1 business day. Note: Only registrants with valid use cases will be contacted.


