
Beyond Plexiglass Covers
How NGC Is Gaining More Insights into Gearbox Oil Splashing by Leveraging Cutting-Edge Simulation Technologies
NGC is leveraging state-of-the-art simulation methods to drive the development of today's wind turbine gearboxes. For this reason, we started an exciting collaboration in 2020. In this article, we want to give you a comprehensive introduction into current challenges in wind turbine gearbox lubrication and new ways to gain insights. We demonstrate the potential of oil simulation and share the results of this cooperation: a comparison between two lubrication concepts for a carrier bearing in a 4-megawatts NGC gearbox. Moreover, we shed light on the workflow of cloud-based fluid simulations in the everyday development of a gearbox manufacturer.
Challenges in Lubricating Wind Turbine Gearboxes
In the following section, we will outline special characteristics of wind turbine gearboxes which must be considered when developing a functioning lubrication concept.
1. Wind Turbine Gearboxes Are Huge!
Wind turbine gearboxes are among the largest and heaviest gearboxes in the world. Over the last few years, these gear units have grown continuously, and this trend will continue. For wind turbines, the generated power scales with its size. Plant manufacturers are therefore striving for larger designs, as this allows more power to be produced.
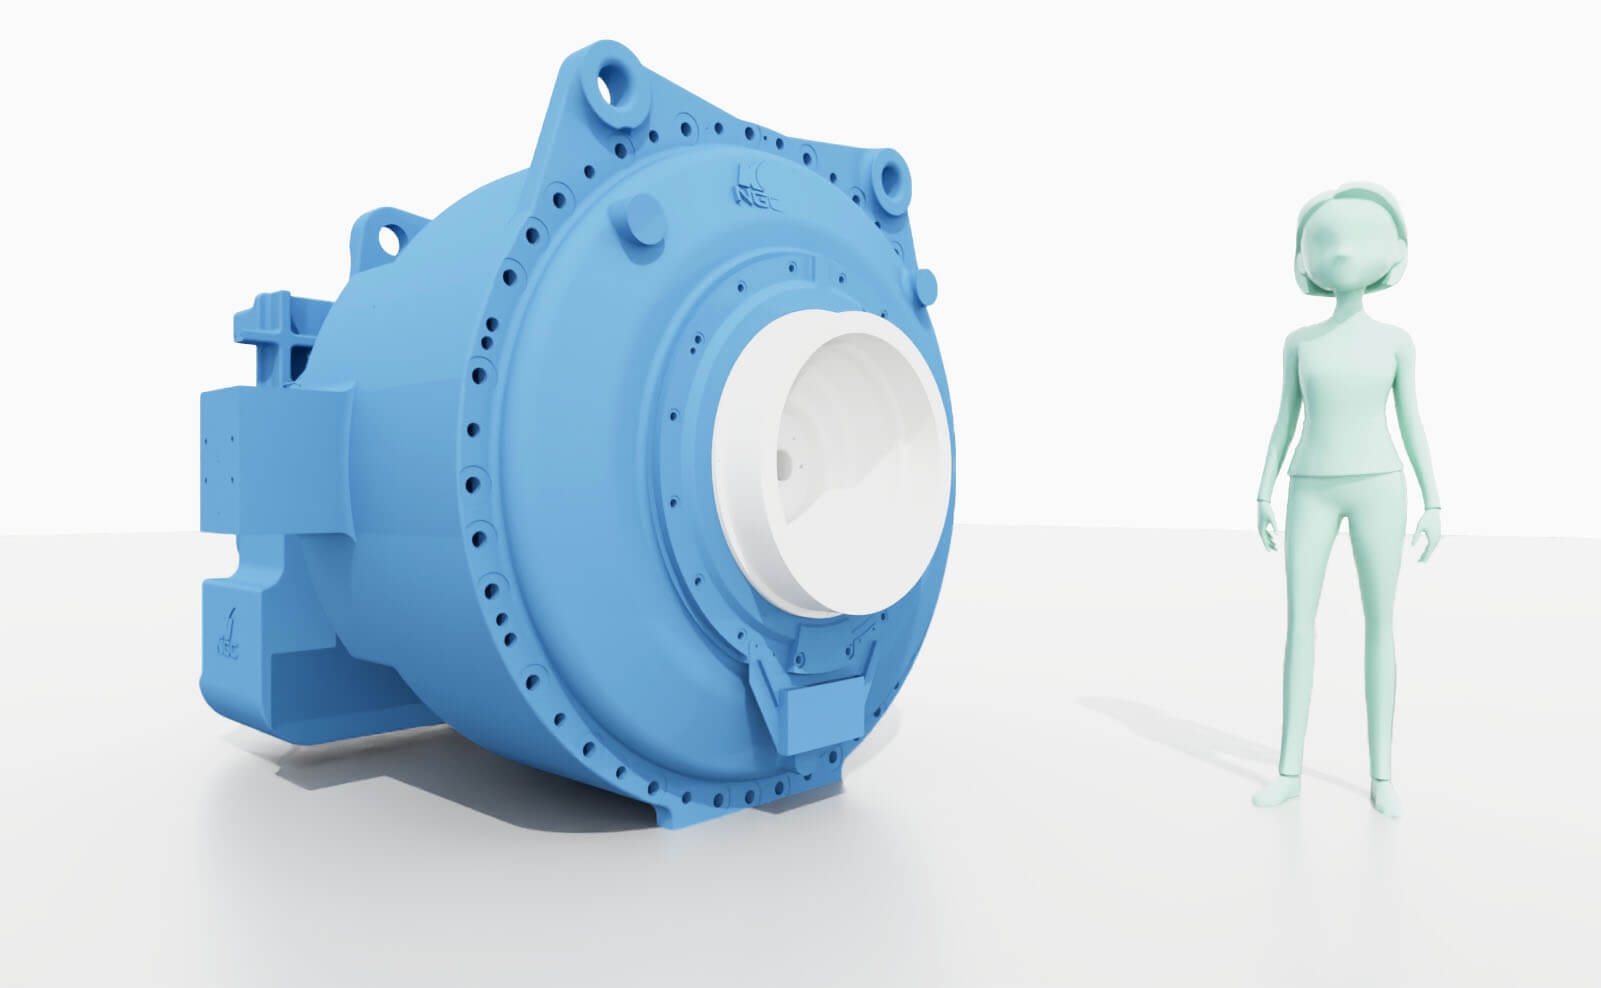
However, the increasing size also poses challenges for gearbox manufacturers: most gear components scale based on the input torque. This does not apply to the planet carrier bearings. Their size is determined by the size of the carrier itself. Compared to the load, they are relatively large. Lubricating all the functional surfaces of such a large bearing can become a challenge and requires special consideration how to distribute the oil.


2. The Input Shaft Operates at Very Low Rotations per Minute
Gearboxes are used in wind turbines to translate the slow input speed of the wind-driven rotor into a fast shaft motion required by the generator. The generator translates the mechanical energy into electricity which is fed into the power grid. Typical rotor speeds are around 8-16 RPMs.
The slow rotational speed poses additional challenges for the engineers. Simple splash lubrication can no longer be relied upon and other lubrication techniques are therefore required. Pumps are often employed to transport the oil to the appropriate locations. This enables target-oriented lubrication. Mechanical pumps are supported by electric pumps which provide additional oil for cooling at high loads. In addition, filters inside the pumps remove contaminants from the oil and thus contribute to an extended service life.
Moving back to the topic at hand: Bearings rotate about half as fast as the shafts. In other words, the large bearings of the input shaft perform just 4 to 8 rotations per minute. In the worst case, this can take up to 15 seconds for one single rotation, meaning that 15 seconds pass under load before a rolling element dips into oil or passes the injection nozzle - that's a lot(!) and we are not yet talking about the start-up phase, which is far beyond the 15 seconds. Ensuring that the functional surfaces are properly lubricated at all times is challenging with such slow rotations.
3. The Operating Conditions Are Anything but a Smooth and Calm Sea!
The topic already implies that the given gearbox is unlikely to be in a well-protected environment with constant temperature conditions. First, we must deal with oscillations of the whole machinery which lead to sloshing of the oil bath. Second, the plants run both in summer and in winter. Thus, temperatures in the start-up phase can vary from around -10°C to 40°C. Just have a look at the exemplary oil type 320: the viscosity at -10°C is 35 times higher than at 40°C!

Gearbox manufacturers must ensure that the bearings are well lubricated even in freezing environments, where oil behaves more like honey than any usual lubricant. Especially the start-up phase is considered a critical point, as the transmission has not yet warmed up to the operating temperature.
Simulation as an Opportunity
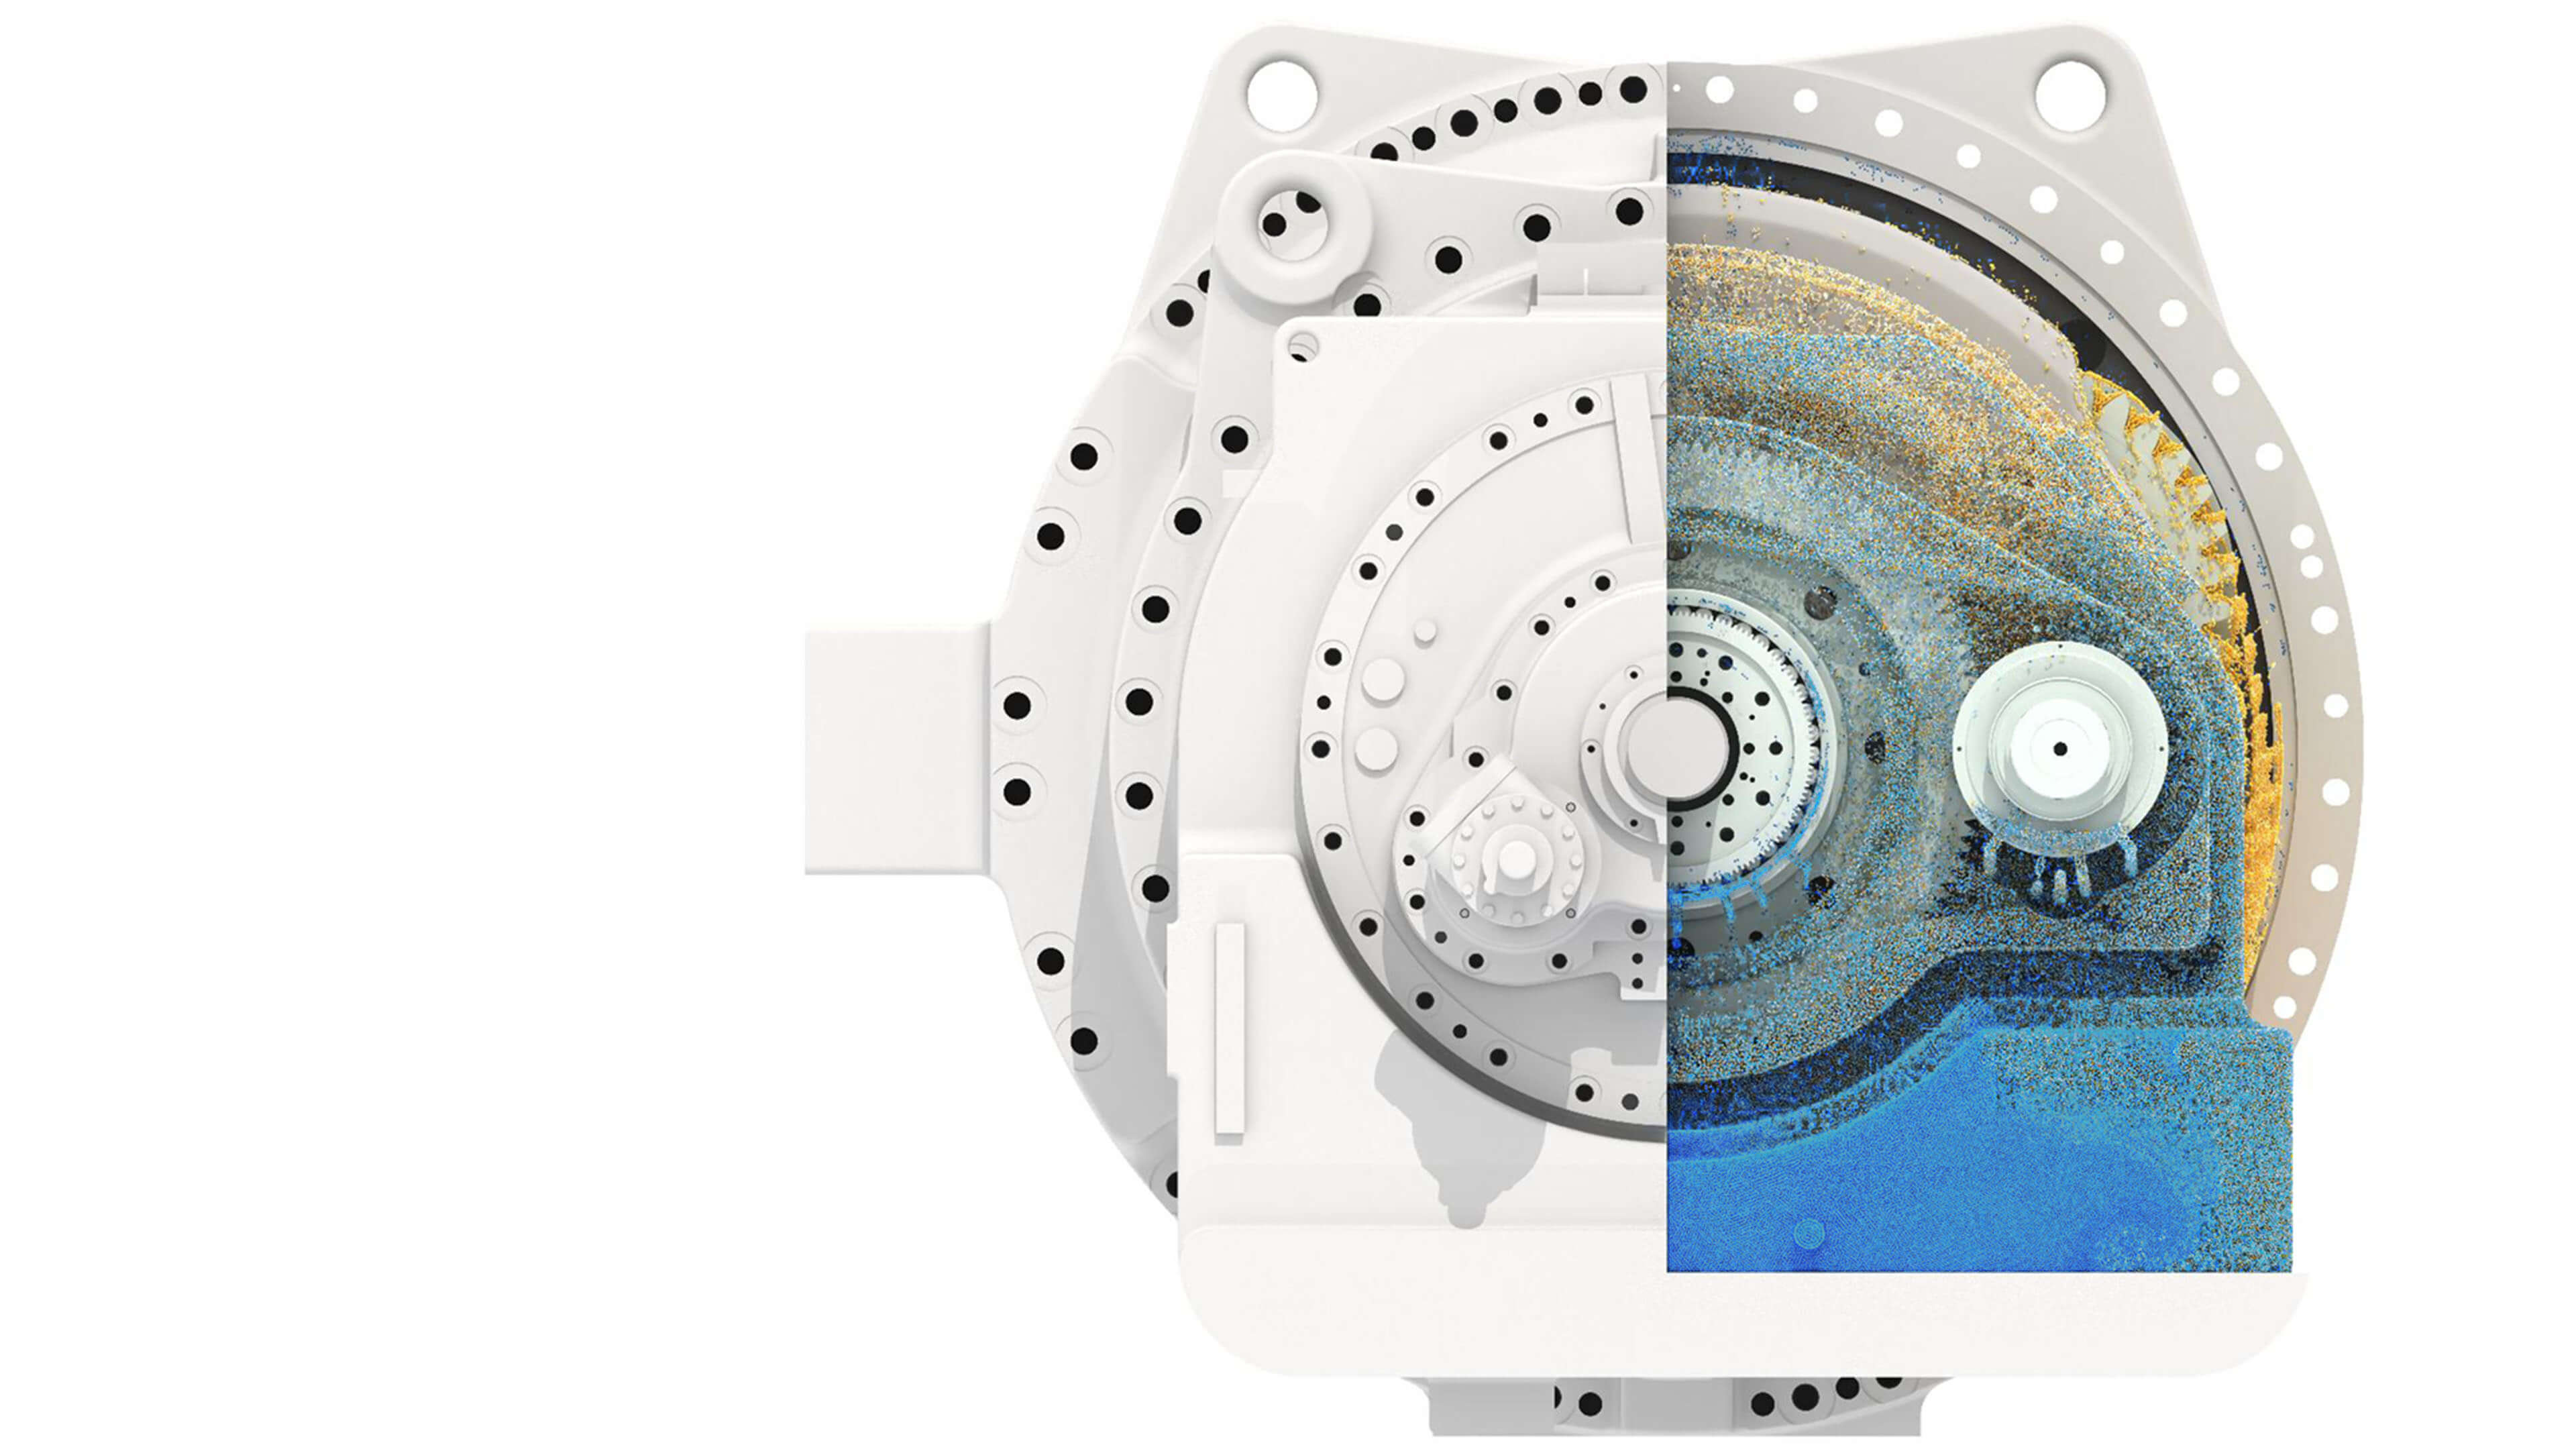
How can one deal with these complexities? Design standards, empirical knowledge in the companies, and experiments in particular help to develop and operate these complex systems. However, many of these approaches are limited in what they can reveal about the real operating conditions of a plant: How can rigid body movements of the nacelle be assessed and evaluated and what is their influence on oil sloshing? How should our test rigs measure whether the large bearings are evenly wetted with oil? Plexiglass covers are a good aid for looking inside gearboxes, but the evaluation capabilities are limited.
At this point, Dive and NGC teamed up to test the potentials but also the boundaries of fluid simulation in wind turbine gearboxes. Can we draw conclusions about the lubrication efficiency in a given operating condition by simulating the oil flow and splashing within the gearbox?
But one step at a time – what is simulation all about …?
Computational Fluid Dynamics (CFD), meaning the simulation of fluids, enables the prediction of flow behavior. To set up a simulation, you must follow these steps:
- Import the geometries from your CAD tool,
- Input the material you want to simulate (for example, a density and a viscosity),
- In the case of a gearbox, give the speed at which the gears rotate.
Based on physical equations, the CFD software now calculates how the material (in this case the oil) behaves over time.

Seems easy, right? But what insights do we get out of it?
The software calculates flow-relevant parameters like velocity, pressure, and temperature at numerous points over time within the oil. These values can then be viewed in a 3D viewer. Furthermore, volume flows, forces on components, or power losses can be generated based on this input.
In regards to wind turbines, we can analyze oil quantities in defined control volumes to make a prognosis about the oil quantity at a certain bearing, we can analyze the wetting behavior of the oil on separate components, we can map the oscillation of the plant to the simulation to gain insight into the real operating conditions, and so on and so on … the use cases are versatile. If you want to know more about simulations in general check out this article which provides an overview of on the basics of simulation and outlines various types of CFD methods.
But now let’s get specific: In the following section, we will compare two lubrication models in terms of their lubrication effect and efficiency.
Simulation setup of the 4-MW NGC gearbox
The analysis is carried out with a gearbox of NGC’s 4 MW class. The load is transmitted by two serial planetary stages on the rotor side, via a helical gear stage to the generator.
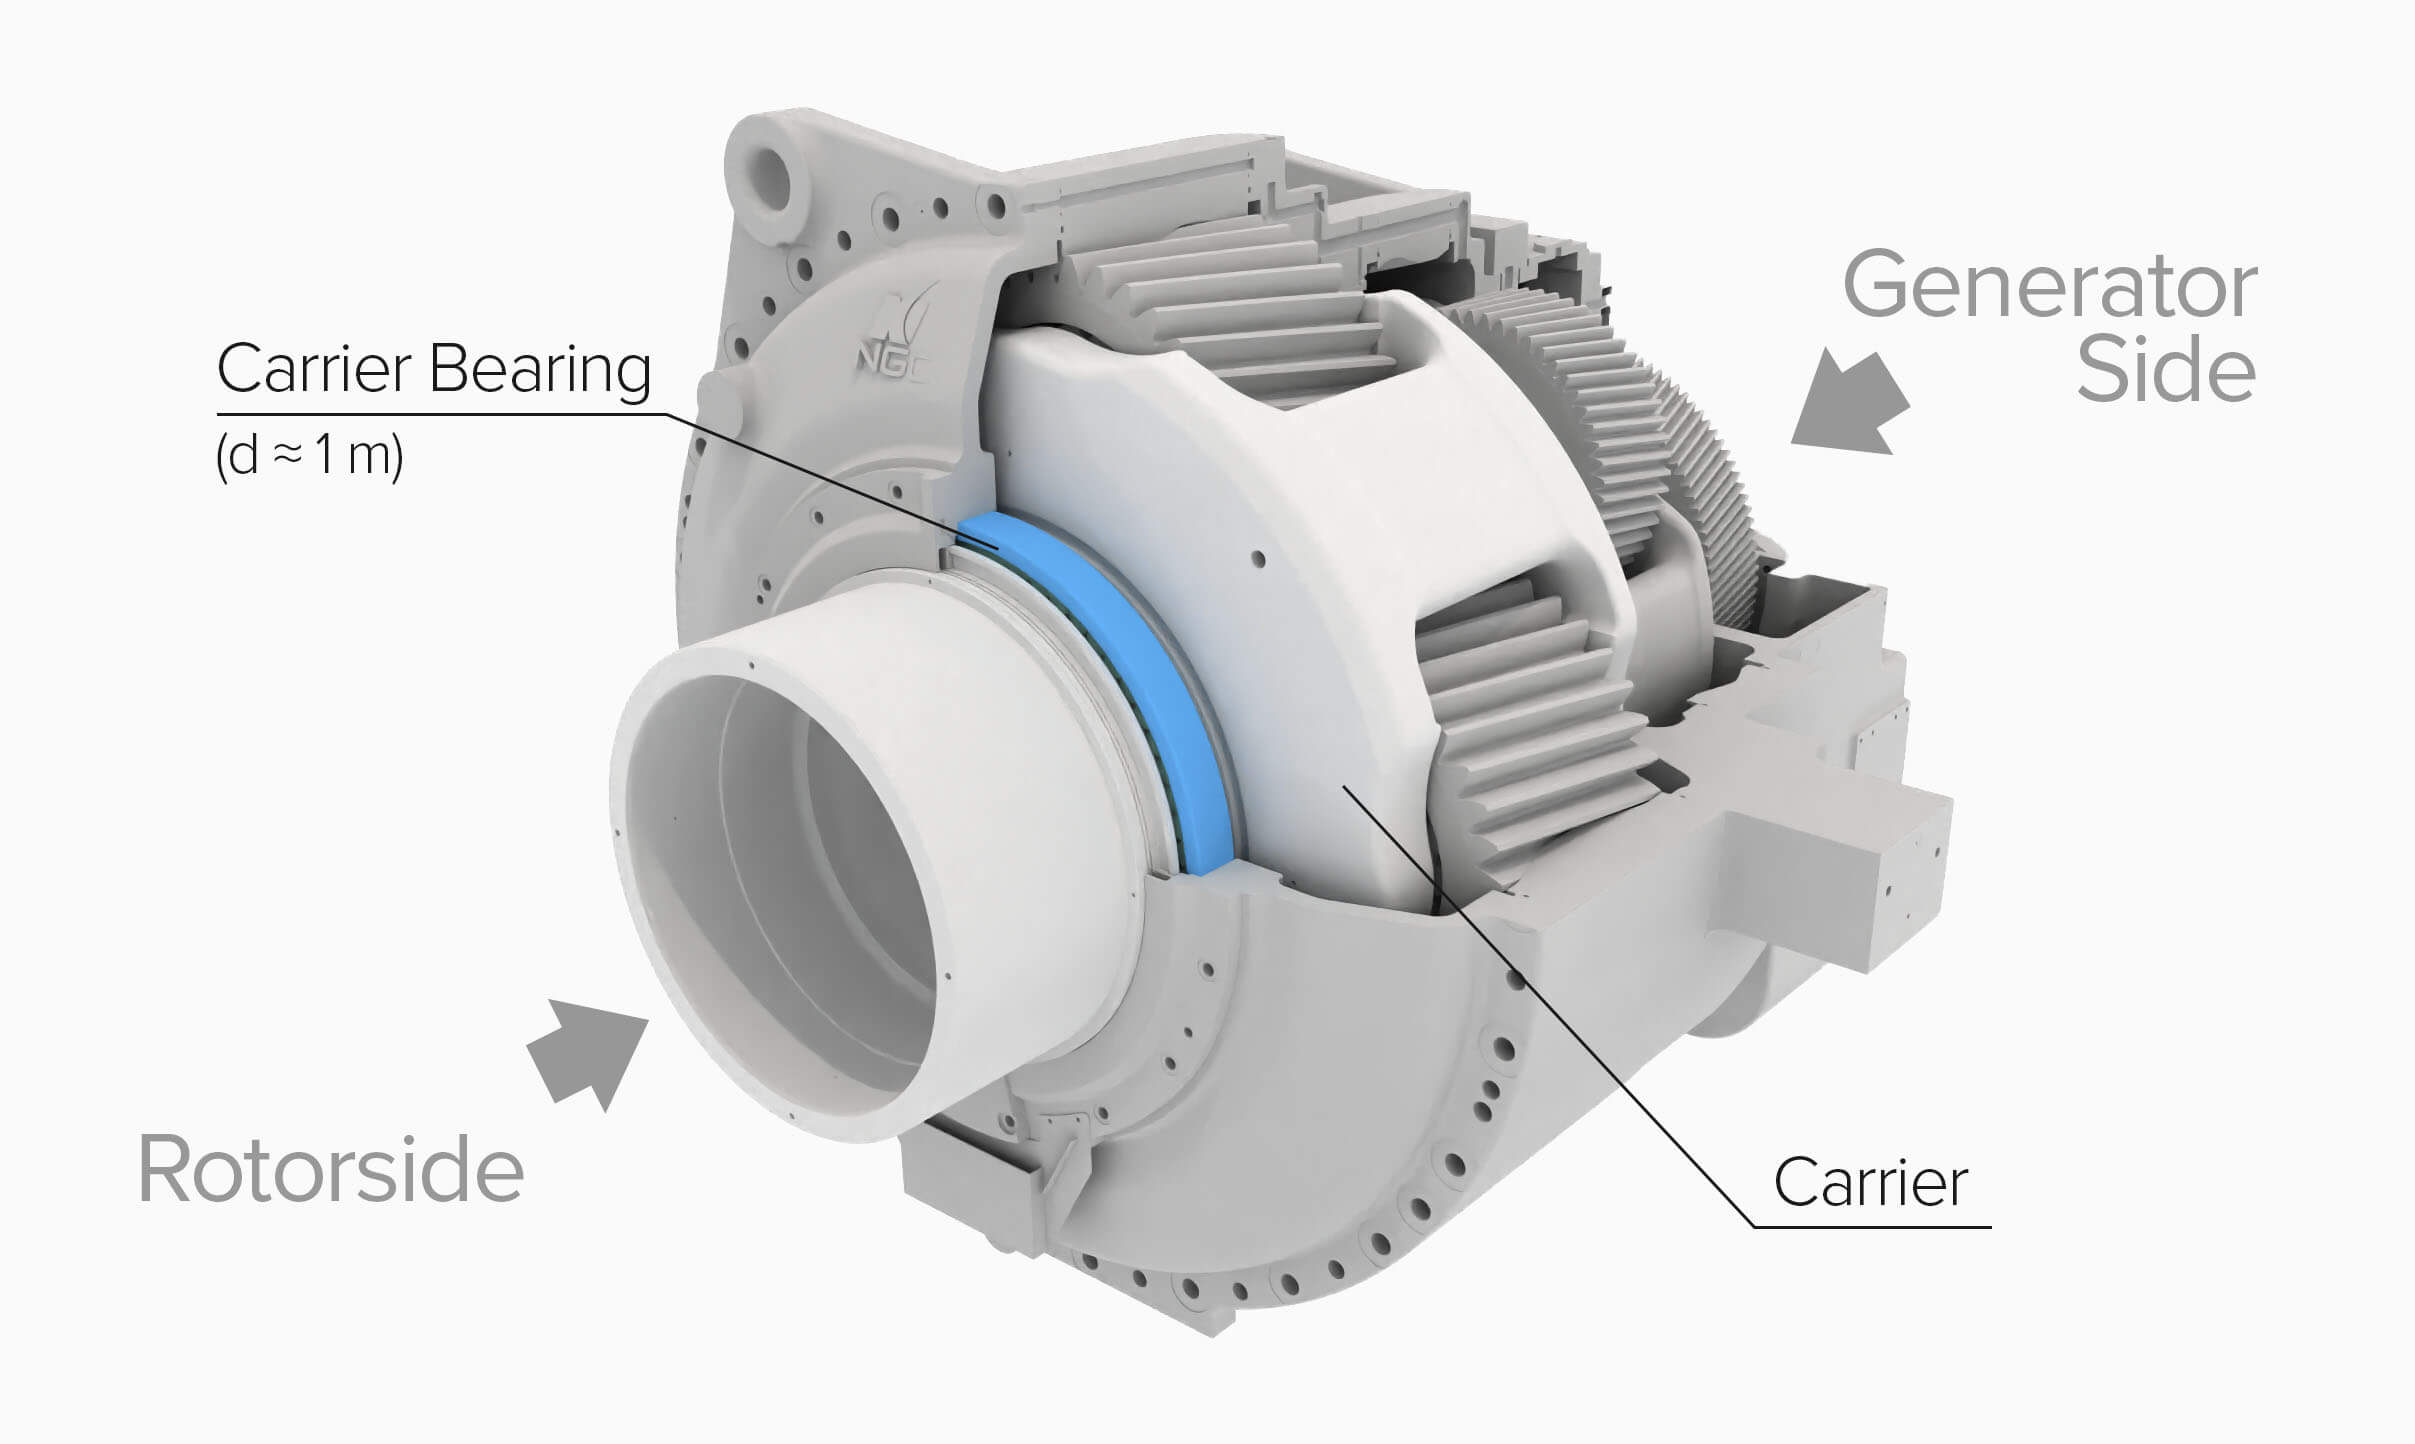
For this gear unit, the lubrication concept consists of a combined splash and pressurized lubrication. The oil pressure is generated by a mechanical pump and, in case of higher heat generation, supported by an electric pump. The carrier bearing requires special attention when selecting a lubrication concept. Due to varying load zones (depending on the wind loads) all functional surfaces need to be lubricated. We will now challenge two well established solutions for planet carrier lubrication with simulation:

A rotating injection nozzle
This lubrication concept consists of an oil injection nozzle directly at the carrier. As the carrier rotates, the oil nozzle also rotates. The nozzle is connected through a drilled hole to the pressured oil guide system located inside the carrier.

A static injection nozzle
In this concept, the oil is fed via the housing to an injection nozzle at 12 o'clock. The nozzle is permanently attached to the housing and thus does not move during operation.
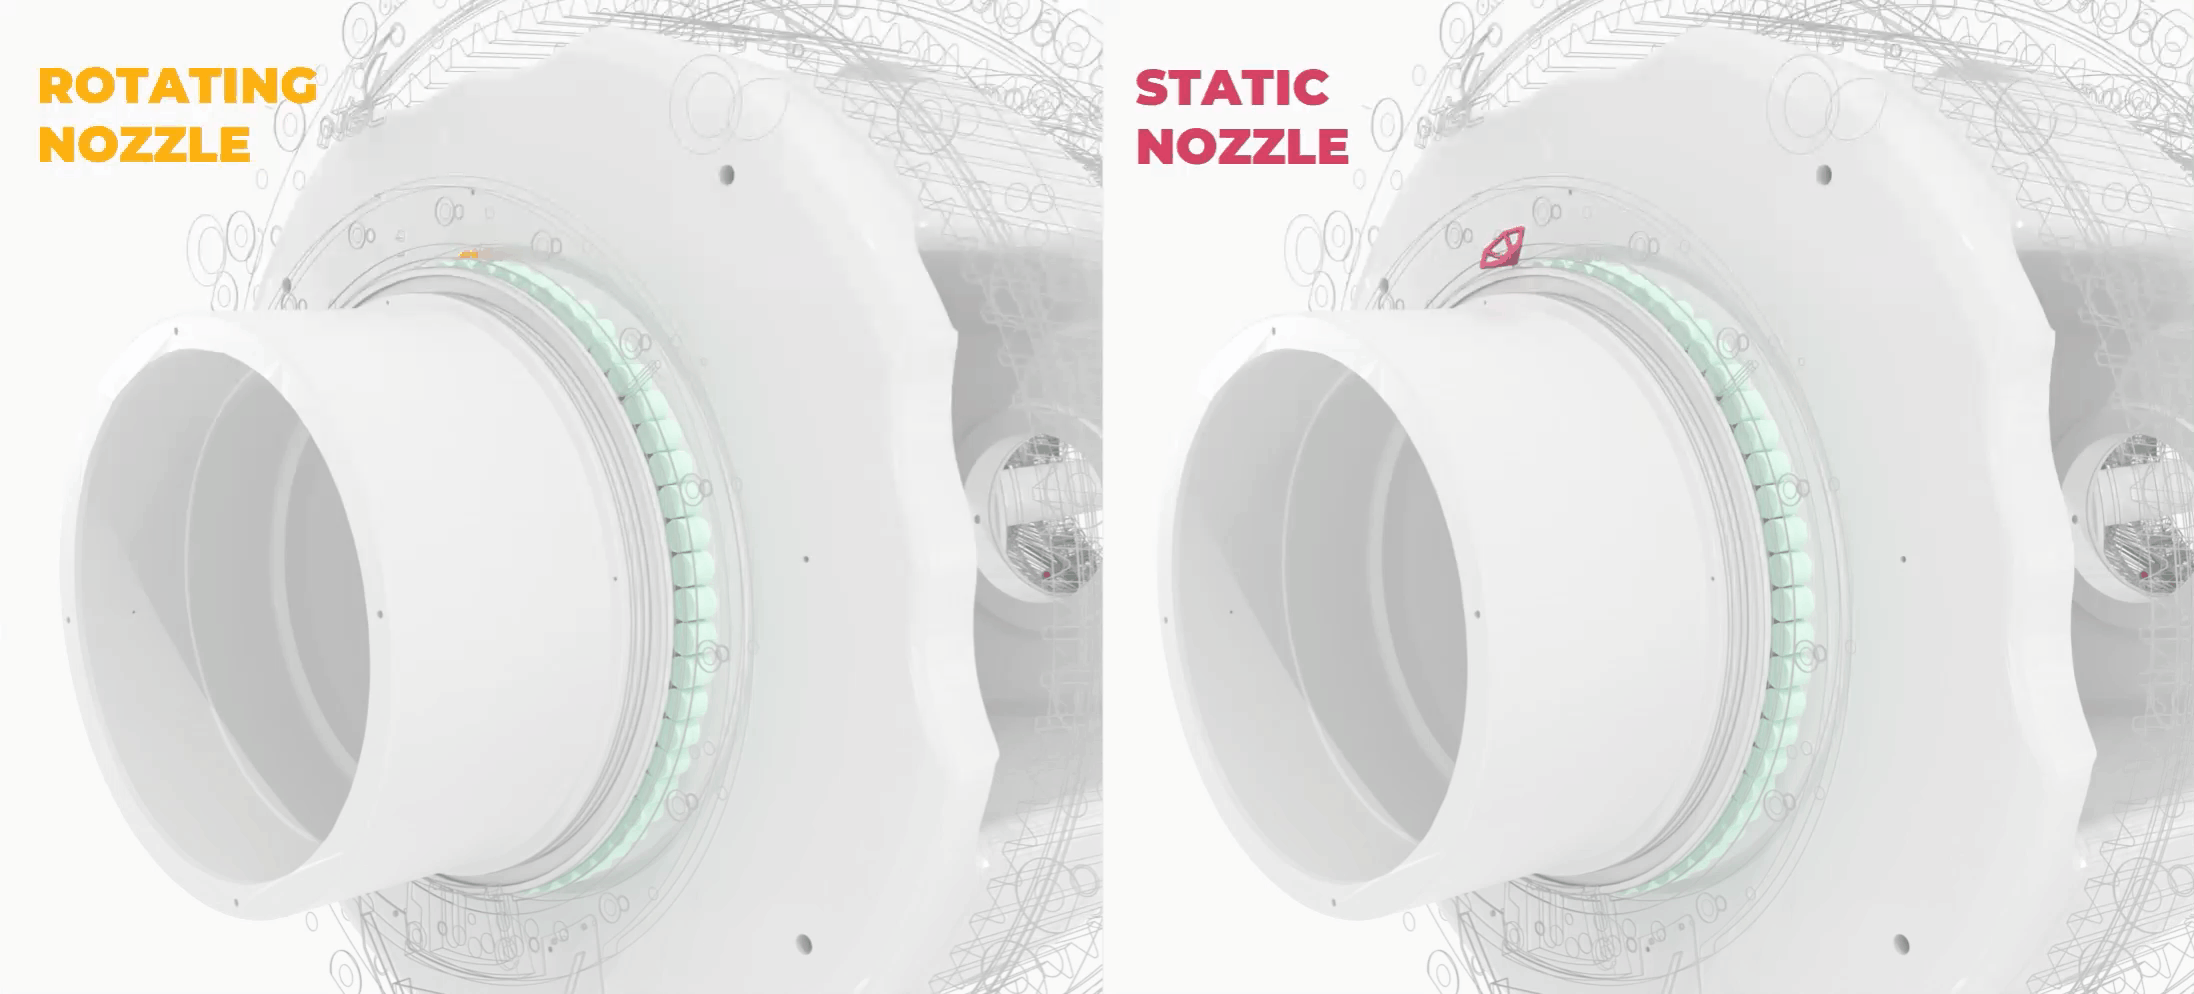
Figure 6: Illustration of the two lubrication concepts in action
Figure 7 illustrates the difference in the design spaces into which the oil is injected. The static nozzle injects oil into a quasi-closed space on the rotor side, whereas the rotating nozzle injects oil into a more open space on the generator side of the bearing.
We challenge the static and rotating nozzle at two operating points:

Mechanical pump, low flow rates
The mechanical pump provides oil for lubricating the bearings during regular operation. We must ensure a sufficient lubrication even with these smaller quantities of oil.

Mechanical + electrical pump, high flow rates
Along with the mechanical pump, the electrical pump provides full power at the oil injection nozzle. This configuration is necessary under high load conditions where the oil also serves to cool the components.
The lubrication concept is compared at both operating points, since the M condition can be seen as critical in terms of oil quantity, while the M+E condition places higher demands on the concept in terms of cooling.
 in %
in % |
 in %
in % |
||
|---|---|---|---|
| Flowrate | 117 |
222 |
 Rotating nozzle
|
| Nozzle Diameter | 67 |
67 |
|
| Flowrate | 100 |
190 |  Static nozzle
|
| Nozzle Diameter | 100 |
100 |
Table 1: Overview of the nozzle parameters for the two lubrication models for both operating conditions
Due to the design conditions, the flow rate for the rotating nozzle concept is 17% higher. However, we presume that the static lubrication concept is superior in terms of lubrication efficiency. Through simulation, we are aiming to make the presumed efficiency advantage visible and validate our assumption.
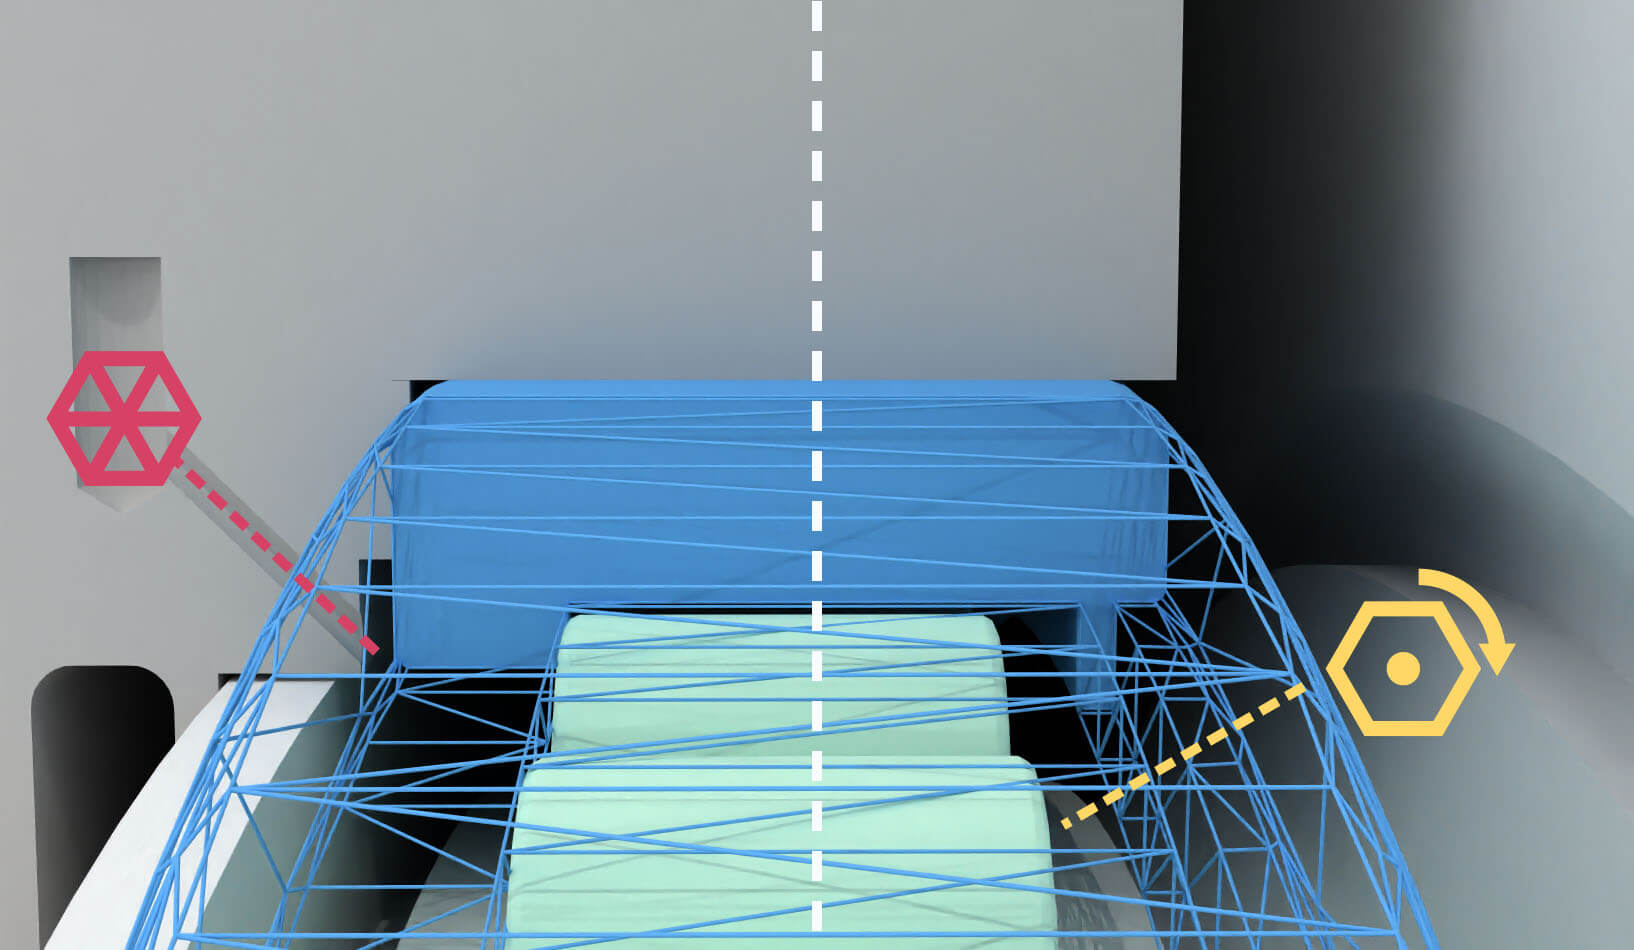
As we focus on the lubrication behavior at the carrier bearing only, we use a subsystem of the entire gearbox for all our simulations. The following figure shows a section of the simulation setup. The bearing rotates at about half the speed of the carrier on its trajectory, the intrinsic rotation of the rolling elements is preserved.
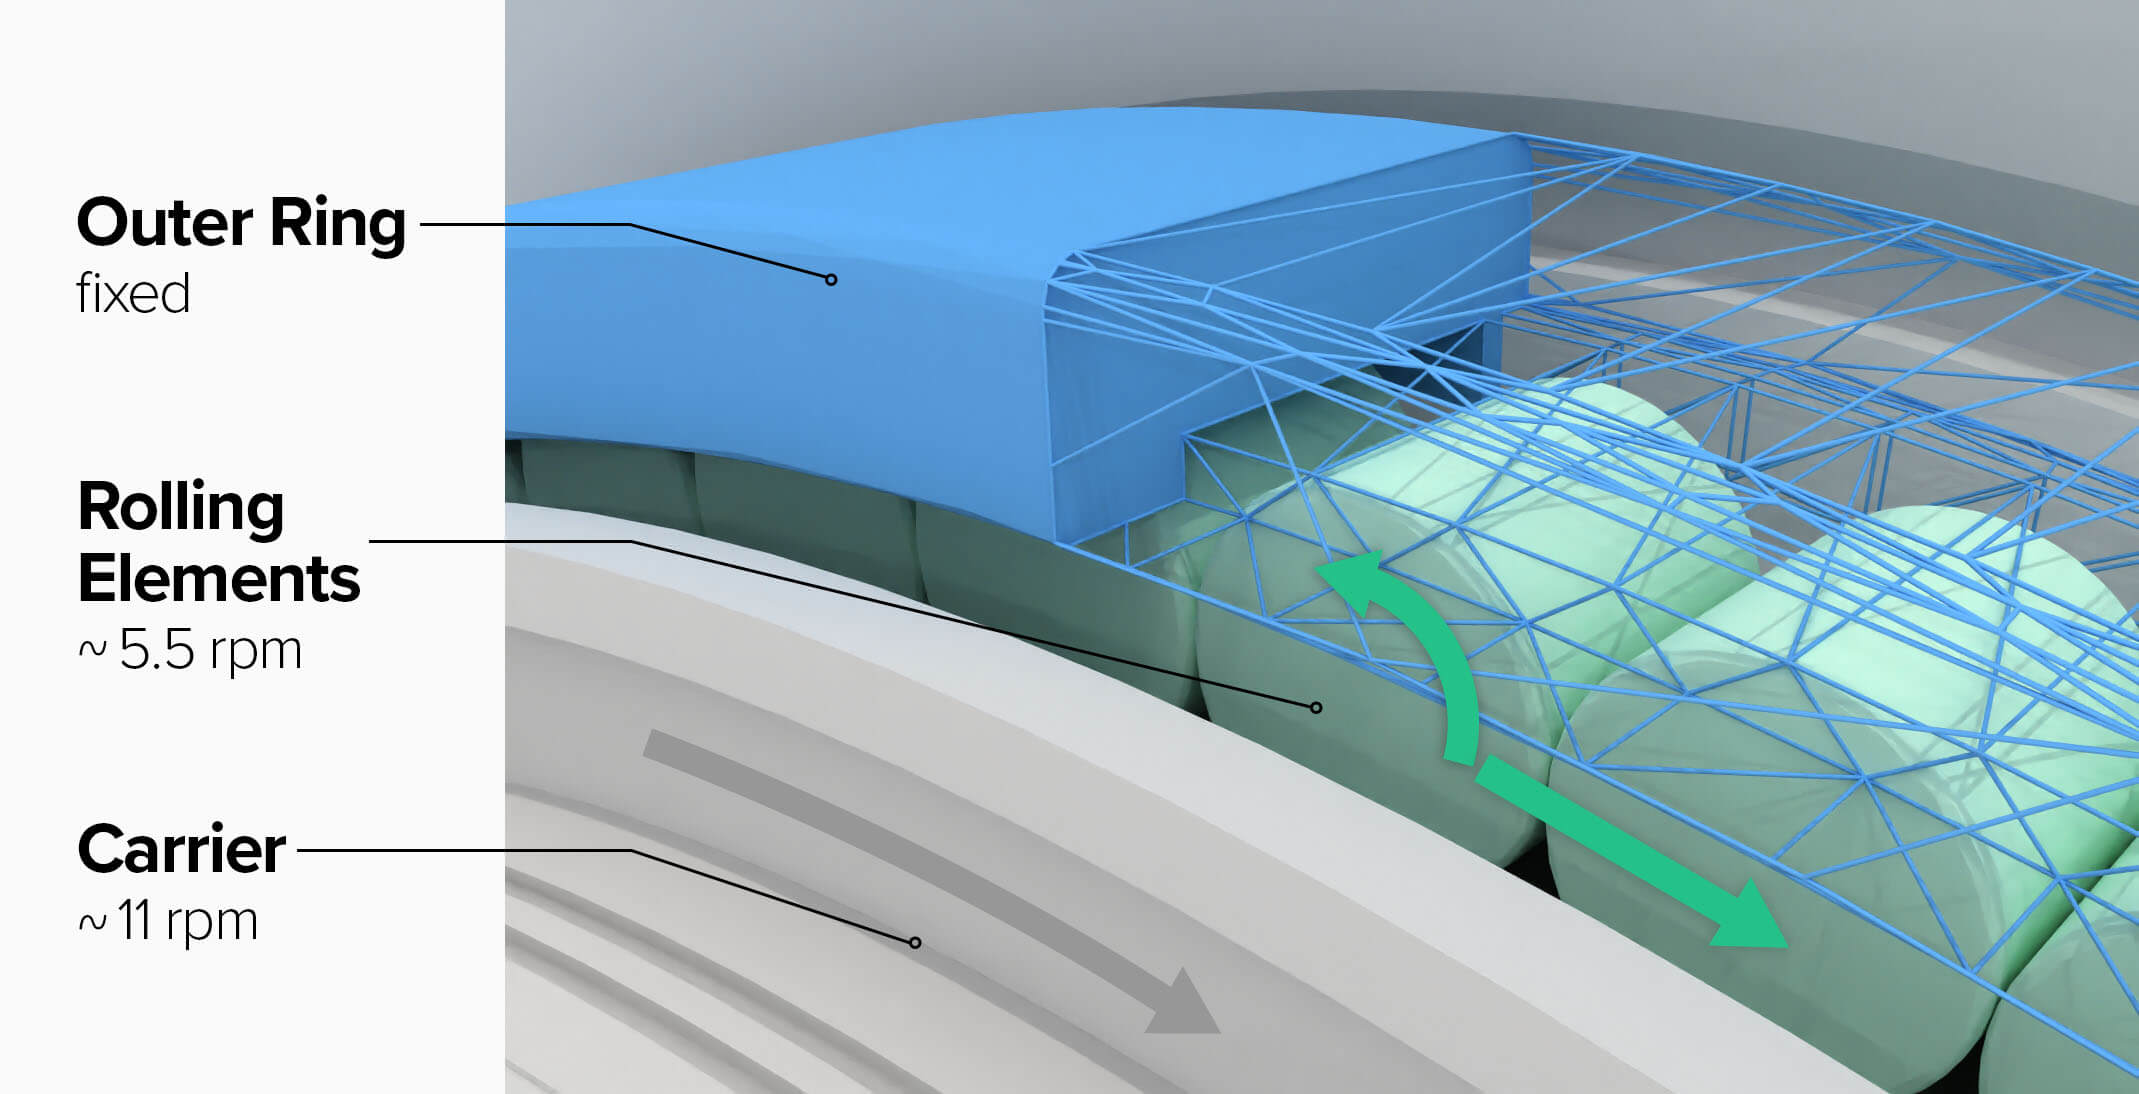
Several preliminary simulation runs have shown that the lubrication characteristics converge after approximately 22 seconds which corresponds to about 4 revolutions of the carrier. In all of our simulations we have assumed a constant viscosity of 163 cSt which corresponds to 50°C oil temperature.
Evaluation of the Simulations
We now compare four simulations regarding (1) their wetting behavior on the entire bearing, (2) on the distribution of the individual components, and (3) regarding the lubrication efficiency.
1. Entire Bearing Analysis: Wetting & Path Lines
In the following wetting analysis, we compare the size of the wetted surface of the carrier bearing (inner ring, outer ring and rolling elements). As a result, we gain a first impression of the wetting behavior over time. We can determine the lubrication effectiveness – meaning the evenness of the oil distribution on the surface.
The diagram shows a qualitative chart of the wetted surface over time. The higher the value, the more surface is in contact with oil.

All variants reach stable wetting of the functional surfaces after one full revolution of the planet carrier, but it is clearly visible that the M+E condition shows a higher wetting compared to the M condition for both lubrication concepts. Since the additional electric pump delivers significantly more oil into the system, the bearings in M+E are also wetted more.
What we also see, however, is that the rotating nozzle leads to lower oil wetting over the entire 22-second period for both, the M+E and the M condition. This is particularly interesting since the volume flow is 17% higher for the rotating nozzle in both operating conditions.
There’s also quite an interesting characteristic in the slope of the wetting curve in the rotating concept: an oscillation matching the frequency of the carrier/nozzle revolutions reflects the wetting behavior.
Let’s have a closer look at the path lines to get a better feel for the oil dynamics:
In fluid dynamics, path lines describe the motion of passive scalars in flow fields over time. In the given simulation method, Smoothed Particle Hydrodynamics (SPH), we can determine these path lines very easily. Due to the Lagrangian nature of the method, we only need to connect the local coordinates of a particle at sequential times to obtain a path line. To learn more about the SPH method and its Lagrangian nature, check out this article.
Figure 10 Video: Comparison of the oil dynamics of the rotating nozzle and the static nozzle, both to the M+E condition. Path lines are used to highlight the oil dynamics. The resolution of the simulations is reduced by a factor of 10 for visualization purposes. Due to the open domain (see Figure 7) oil is splashing away in the rotating nozzle concept
The path lines illustrate the difference between the two lubrication concepts. With a static injection at 12 o'clock, the oil flows at least half a revolution before it reaches the lower drain. In the case of the rotating nozzle, we see two phenomena:
- the oil splashes off the bearing between 3 and 9 o'clock.
- the oil that is injected anywhere but at 12 o'clock it will stay in the system for a shorter amount of time, since its injection position is closer to the lower drain.
Phenomenon (i) can be used as an explanation for the oscillating wetting behavior in the wetting graph above. Both phenomena together probably cause the rotating nozzle concept to wet slightly less than the static nozzle concept.
2. Oil Wetting on Individual Components
One of the biggest advantages of simulations is the incredible variety of evaluation scenarios. It is also possible to evaluate the wetting behavior not only on the bearing as a whole, but also on the individual components. Performing this provides detailed insights into the lubricant distribution.
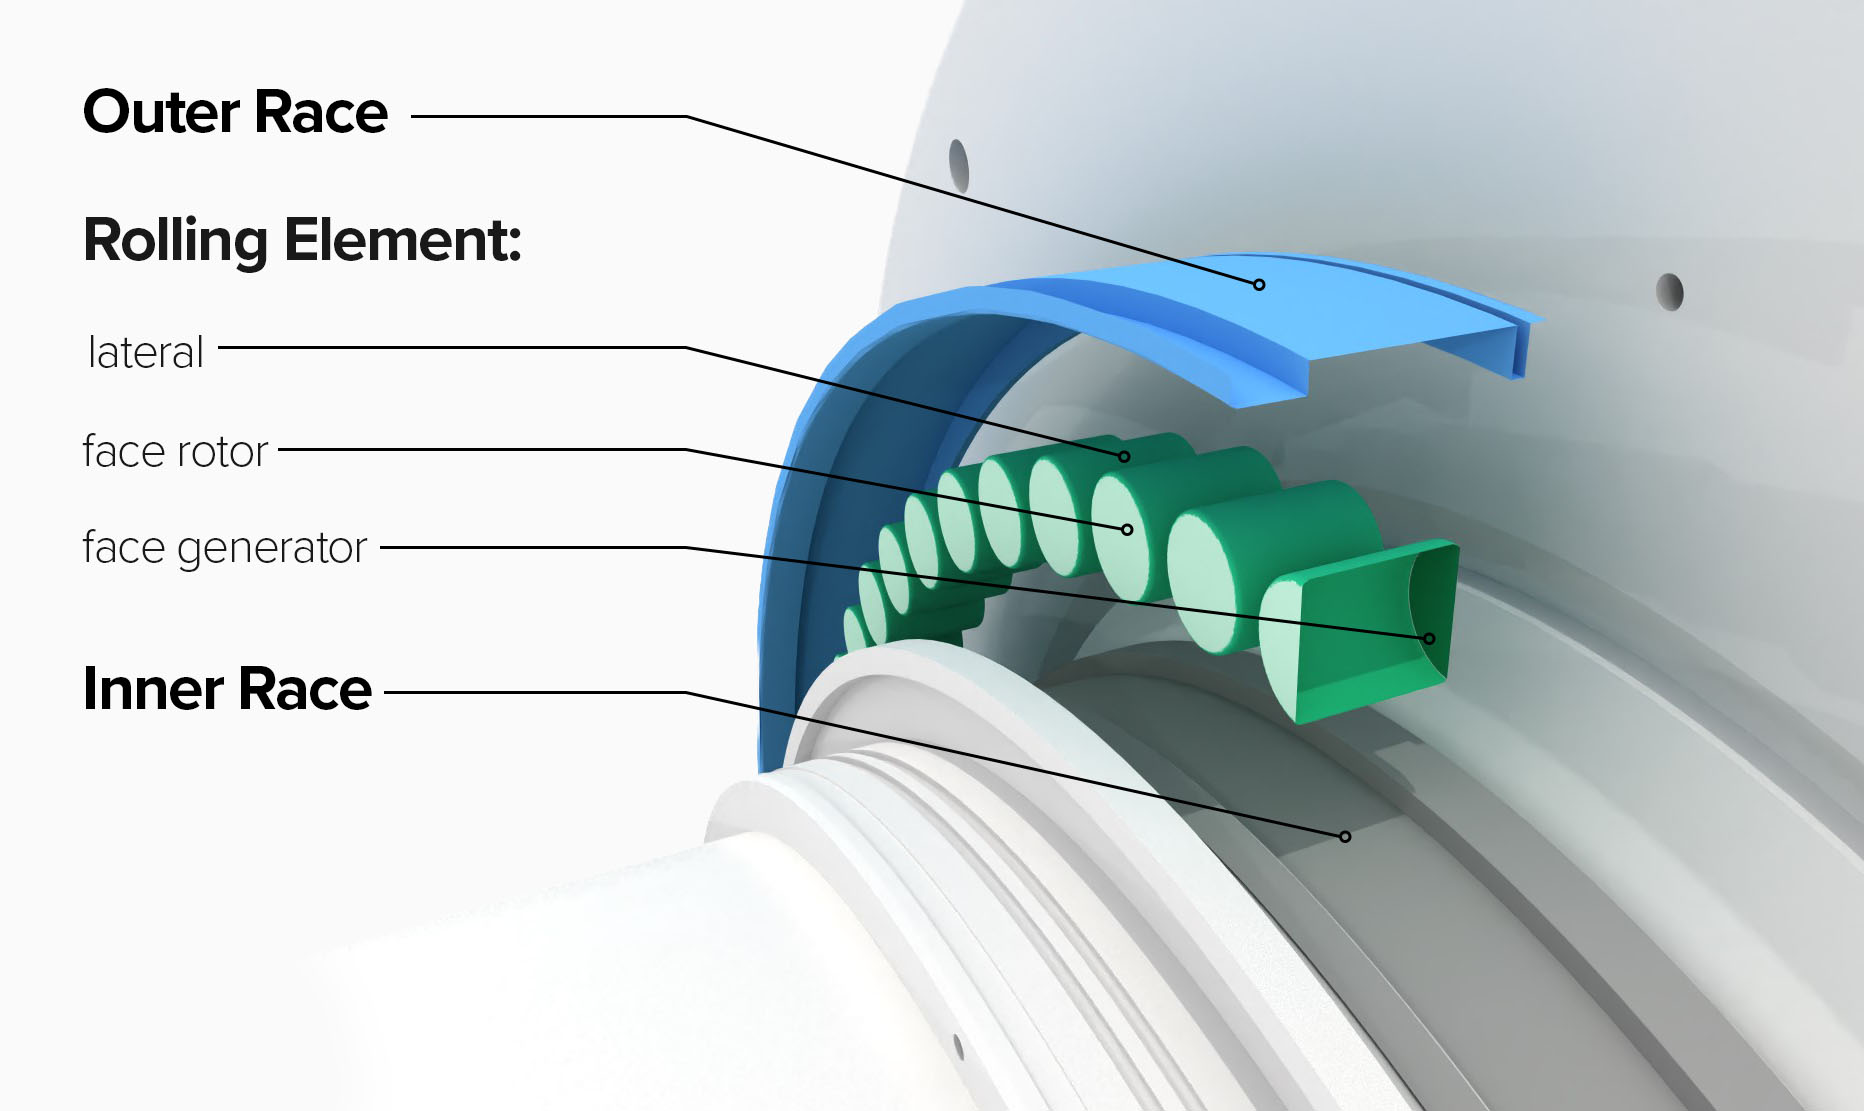
Both lubrication models are able to wet the rolling elements from all sides. Since the nozzles are placed once on the rotor side and once on the generator side, the dominant lubrication side differs. In the case of the rotating nozzle, the generator side is lubricated more, whereas in the static nozzle, the rotor side is lubricated to a greater extent. However, the opposite side (face rotor - light green) of the rotating nozzle seems to be wetted more slowly than the opposite side (face generator - dark green) of the static nozzle.

3. Lubrication Efficiency
Until now, we have compared the lubrication qualitatively only. Let’s crunch some numbers to quantify the comparison!
To analyze lubrication efficiency, we determine how many liters of oil remain within a control volume around the carrier bearing after the simulation converged. We put this in relation to the oil already injected. This procedure allows us to compare the two lubrication concepts by only one value, following the principle: keep it simple, stupid.
| Injected oil in liters | Oil in control volume in liters | ||
|---|---|---|---|
|
|
Rotating concept Static concept |
1 0.85 |
0.43 0.51 |
|
Rotating concept Static concept |
1.67 1.42 |
0.58 0.66 |
Table 2: Comparison of total injected oil to remaining oil in a control volume around the bearing after the simulation converged
To calculate the efficiency, we now set the oil in the control volume in relation to the total amount of injected oil:
Efficiency = Oil in control volume / Injected Oil
| Rotating nozzle efficiency in % | Static nozzle efficiency in % | |
|---|---|---|
|
|
43 |
60 |
|
34.7 |
46.5 |
Table 3: Comparison of the efficiency after the simulation converged
Both for low flow rates (mechanical pump only) and for high flow rates (mechanical and electric pumps), the static injection nozzle shows better lubrication efficiency. In addition, we see that, overall, the efficiency for the mechanical pump (m condition) in static lubrication is the highest.
Why is that?
As seen in the path line video, oil is splashed away from the bearings in the rotating nozzle simulation. In addition, the rotation causes the nozzle on average to be closer to the drain, which means that the oil will drain faster and remain in the control volume for a shorter amount of time.
Conclusion
So, what did we find out?
Using flow simulation, we were able to determine that static lubrication shows advantages when compared with rotating lubrication for both operating conditions (mechanical pump and mechanical + electrical pump). More oil reaches the bearing, both in terms of efficiency and absolute values. Moreover, the uniformity of the lubrication and the time until the lubrication process converges is of particular interest to us. In both cases, the static nozzle seems superior to the rotating one.
Our initial assumption regarding the lubrication models was confirmed by leveraging fluid simulation. From a physical point of view, we now want to increase the complexity and tackle the next challenge! We want to investigate oil leakage induced by sloshing and dig deeper into emergency lubrication. For example - how can you manage to supply oil to the critical parts of a gearbox without using a mechanical pump in the event of a power failure? Well, let's have a look at these topics in an upcoming article … 😉
Apart from pure physics, we evaluated the entire workflow of fluid simulations in the cloud. Starting with exporting the data from CAD, setting up the simulation in the web application, running the simulation in the cloud, and, finally, analyzing the results and gaining valuable insights. During the collaboration with NGC, we needed to enable the use-case by adding the intrinsic rotation definition of rolling elements to the software. We made it available during the project. Nevertheless, in the end we managed to map and validate the cloud CAE workflow as a whole ✔️.
Finally, we would like to present you a teaser of the entire system simulation. The simulation consists of a total of 584 rotating solid objects (11 gears, 550 rolling elements, 23 auxiliaries) and a total of 35 oil inlet nozzles, 9 of which rotate. Each rolling element receives the correct, occurring rolling motion.
We all are very excited and eager to see the upcoming projects between NGC and Dive.
Figure 13 Video: Entire system simulation of the 4-MW Wind Turbine Gearbox